W poprzednim wpisie narysowaliśmy wykres liniowy przy użyciu SVG i skryptu JavaScript D3.
Czas dodać pewne małe zmiany do naszego wykresu liniowego. Po pierwsze do wyświetlania danych zazwyczaj otrzymamy tablice obiektów, a nie tablice wartości.
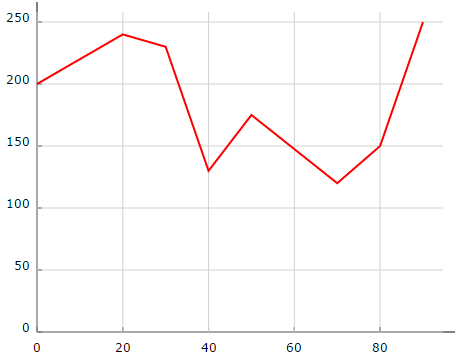
Sam wykres nie ma też kropek w miejscach, gdzie powinny być wartości. Osie X i Y nie mają strzałek. Wykres nie ma tytułu. Osie nie są podpisane.
Są to drobne rzeczy, ale bez nich wykres może wyglądać blado. Zacznijmy więc przerabiać kod.
Jak obsłużyć tablice obiektów?
w = 450;
h = 350;
margin_x = 32;
margin_y = 20;

var objects = [{ x: 0, y: 200 }, { x: 10, y: 220 }, { x: 20, y: 240 },
{ x: 30, y: 230 }, { x: 40, y: 130 }, { x: 50, y: 175 },
{ x: 70, y: 120 }, { x: 80, y: 150 }, { x: 90, y: 250 }];
Oto więc tablica obiektów. Zadanie i tak sobie ułatwiłem, ponieważ obiekt ten ma właściwości x i y.
Zanim zaczniemy rysować nowy kolejny wykres, musimy ustalić maksymalne wartości właściwości x i y.
Wiele funkcji D3 korzysta z tablic, dlatego warto przerobić naszą tablicę obiektów na dwie tablice z wartościami osi X i Y.
var ax = [];
var ay = [];

objects.forEach(function (d, i) {
    ax[i] = d.x;
    ay[i] = d.y;
})

var xMax = d3.max(ax);
var yMax = d3.max(ay);
Używając funkcji d3 z tych dwóch tablic, możemy uzyskać maksymalną wartość.
W analogiczny sposób musimy stworzyć funkcję skalującą.
y = d3.scale.linear().domain([0, yMax]).range([0 + margin_y, h - margin_y]);
x = d3.scale.linear().domain([0, xMax]).range([0 + margin_x, w - margin_x]);

var line = d3.svg.line()
.x(function (d) { return x(d.x); })
.y(function (d) { return -y(d.y); })
Reszta kodu nie bardzo się zmienia. Trzeba jednak dodać zmienną yMax w paru funkcjach rysujących.
// draw the y axis
g.append("svg:line")
    .attr("x1", x(0))
    .attr("y1", -y(0))
    .attr("x2", x(0))
    .attr("y2", -y(yMax) - 20)
//draw the x grid
g.selectAll(".xGrids")
.data(x.ticks(5))
.enter().append("svg:line")
.attr("class", "xGrids")
.attr("x1", function (d) { return x(d); })
.attr("y1", -y(0))
.attr("x2", function (d) { return x(d); })
.attr("y2", -y(yMax) - 10)Cały kod rysujący wykres wygląda tak.
w = 450;
h = 350;
margin_x = 32;
margin_y = 20;
var objects = [{ x: 0, y: 200 }, { x: 10, y: 220 }, { x: 20, y: 240 },
{ x: 30, y: 230 }, { x: 40, y: 130 }, { x: 50, y: 175 },
{ x: 70, y: 120 }, { x: 80, y: 150 }, { x: 90, y: 250 }];
var ax = [];
var ay = [];
objects.forEach(function (d, i) {
ax[i] = d.x;
ay[i] = d.y;
})
var xMax = d3.max(ax);
var yMax = d3.max(ay);
y = d3.scale.linear().domain([0, yMax]).range([0 + margin_y, h - margin_y]);
x = d3.scale.linear().domain([0, xMax]).range([0 + margin_x, w - margin_x]);
var line = d3.svg.line()
.x(function (d) { return x(d.x); })
.y(function (d) { return -y(d.y); })
var svg = d3.select("body")
.append("svg:svg")
.attr("width", w)
.attr("height", h)
var g = svg.append("svg:g")
.attr("transform", "translate(0," + h + ")");
// draw the x axis
g.append("svg:line")
.attr("x1", x(0))
.attr("y1", -y(0))
.attr("x2", x(w))
.attr("y2", -y(0))
// draw the y axis
g.append("svg:line")
.attr("x1", x(0))
.attr("y1", -y(0))
.attr("x2", x(0))
.attr("y2", -y(yMax) - 20)
//draw the xLabels
g.selectAll(".xLabel")
.data(x.ticks(5))
.enter().append("svg:text")
.attr("class", "xLabel")
.text(String)
.attr("x", function (d) { return x(d) })
.attr("y", 0)
.attr("text-anchor", "middle");
// draw the yLabels
g.selectAll(".yLabel")
.data(y.ticks(5))
.enter().append("svg:text")
.attr("class", "yLabel")
.text(String)
.attr("x", 25)
.attr("y", function (d) { return -y(d) })
.attr("text-anchor", "end");
//draw the x ticks
g.selectAll(".xTicks")
.data(x.ticks(5))
.enter().append("svg:line")
.attr("class", "xTicks")
.attr("x1", function (d) { return x(d); })
.attr("y1", -y(0))
.attr("x2", function (d) { return x(d); })
.attr("y2", -y(0) - 5)
// draw the y ticks
g.selectAll(".yTicks")
.data(y.ticks(5))
.enter().append("svg:line")
.attr("class", "yTicks")
.attr("y1", function (d) { return -1 * y(d); })
.attr("x1", x(0) + 5)
.attr("y2", function (d) { return -1 * y(d); })
.attr("x2", x(0))
//draw the x grid
g.selectAll(".xGrids")
    .data(x.ticks(5))
    .enter().append("svg:line")
    .attr("class", "xGrids")
    .attr("x1", function (d) { return x(d); })
    .attr("y1", -y(0))
    .attr("x2", function (d) { return x(d); })
    .attr("y2", -y(yMax) - 10)
// draw the y grid
g.selectAll(".yGrids")
.data(y.ticks(5))
.enter().append("svg:line")
.attr("class", "yGrids")
.attr("y1", function (d) { return -1 * y(d); })
.attr("x1", x(xMax) + 20)
.attr("y2", function (d) { return -y(d); })
.attr("x2", x(0))
g.append("svg:path").attr("d", line(objects));Teraz możemy się zająć kolejnym problem związanym z naszym wykresem.
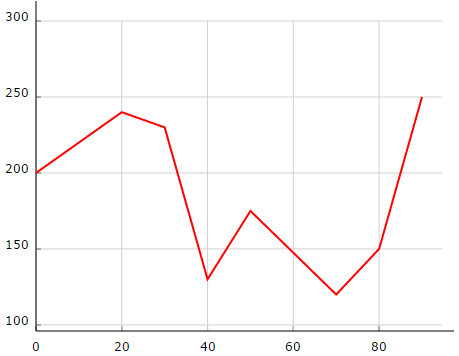
Otóż wcześniej mieliśmy wartości na osi Y od 0 do 0. Teraz wartości na osi Y są bardzo wysoko. Przestrzeń wartości pomiędzy 0 a 100 jest w ogóle niepotrzebna. Jest to pusta przestrzeń.
Problem będzie jeszcze gorszy, jeśli będziemy mieli jeszcze większe wartości na osi Y. Musimy więc to jakoś ograniczyć.
Kontrolowanie zakresu Osi
Musimy stworzyć limity na funkcji tworzącej skale osi X i Y.
Limit górny osi Y jest większy o 20% od największej wartości. Limit dolny osi Y jest mniejszy o 20% od najmniejszej wartości ze zbioru Y.
var xLowLim = 0;
var xUpLim = d3.max(ax);
var yUpLim = 1.2 * d3.max(ay);
var yLowLim = 0.8 * d3.min(ay);

y = d3.scale.linear().domain([yLowLim, yUpLim]).range([0 + margin_y, h - margin_y]);
x = d3.scale.linear().domain([xLowLim, xUpLim]).range([0 + margin_x, w - margin_x]);
Limity muszą być dodane w wielu innych miejscach. Rysowanie osi X i Y musi być spójne z funkcją skalowania wartości funkcji .itp.
w = 450;
h = 350;
margin_x = 32;
margin_y = 20;

var objects = [{ x: 0, y: 200 }, { x: 10, y: 220 }, { x: 20, y: 240 },
        { x: 30, y: 230 }, { x: 40, y: 130 }, { x: 50, y: 175 },
        { x: 70, y: 120 }, { x: 80, y: 150 }, { x: 90, y: 250 }];

var ax = [];
var ay = [];

objects.forEach(function (d, i) {
    ax[i] = d.x;
    ay[i] = d.y;
})

var xMax = d3.max(ax);
var yMax = d3.max(ay);


var xLowLim = 0;
var xUpLim = d3.max(ax);
var yUpLim = 1.2 * d3.max(ay);
var yLowLim = 0.8 * d3.min(ay);

y = d3.scale.linear().domain([yLowLim, yUpLim]).range([0 + margin_y, h - margin_y]);
x = d3.scale.linear().domain([xLowLim, xUpLim]).range([0 + margin_x, w - margin_x]);

var line = d3.svg.line()
    .x(function (d) { return x(d.x); })
    .y(function (d) { return -y(d.y); })


var svg = d3.select("body")
    .append("svg:svg")
    .attr("width", w)
    .attr("height", h)

var g = svg.append("svg:g")
    .attr("transform", "translate(0," + h + ")");


//draw the x ticks
g.selectAll(".xTicks")
    .data(x.ticks(5))
    .enter().append("svg:line")
    .attr("class", "xTicks")
    .attr("x1", function(d) { return x(d); }).attr("y1", -y(yLowLim))
    .attr("x2", function(d) { return x(d); })
    .attr("y2", -y(yLowLim) - 5);

// draw the y ticks
g.selectAll(".yTicks")
 .data(y.ticks(5))
 .enter().append("svg:line")
 .attr("class", "yTicks")
 .attr("y1", function (d) { return -y(d); })
 .attr("x1", x(xLowLim))
 .attr("y2", function (d) { return -y(d); })
 .attr("x2", x(xLowLim) + 5)
//draw the x grid
g.selectAll(".xGrids")
 .data(x.ticks(5))
 .enter().append("svg:line")
 .attr("class", "xGrids")
 .attr("x1", function (d) { return x(d); })
 .attr("y1", -y(yLowLim))
 .attr("x2", function (d) { return x(d); })
 .attr("y2", -y(yUpLim))

// draw the y grid
g.selectAll(".yGrids")
 .data(y.ticks(5))
 .enter().append("svg:line")
 .attr("class", "yGrids")
 .attr("y1", function (d) { return -y(d); })
 .attr("x1", x(xUpLim) + 20)
 .attr("y2", function (d) { return -y(d); })
 .attr("x2", x(xLowLim))
// draw the x axis
g.append("svg:line")
 .attr("x1", x(xLowLim))
 .attr("y1", -y(yLowLim))
 .attr("x2", 1.2 * x(xUpLim))
 .attr("y2", -y(yLowLim))
// draw the y axis
g.append("svg:line")
 .attr("x1", x(xLowLim))
 .attr("y1", -y(yLowLim))
 .attr("x2", x(xLowLim))
 .attr("y2", -1.2 * y(yUpLim))


//draw the xLabels
g.selectAll(".xLabel")
    .data(x.ticks(5))
    .enter().append("svg:text")
    .attr("class", "xLabel")
    .text(String)
    .attr("x", function (d) { return x(d) })
    .attr("y", 0)
    .attr("text-anchor", "middle");

// draw the yLabels
g.selectAll(".yLabel")
    .data(y.ticks(5))
    .enter().append("svg:text")
    .attr("class", "yLabel")
    .text(String)
    .attr("x", 25)
    .attr("y", function (d) { return -y(d) })
    .attr("text-anchor", "end");

g.append("svg:path").attr("d", line(objects));
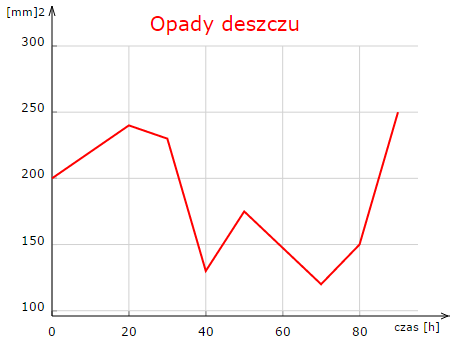
Oto jak wygląda poprawiony wykres. Widać, że wartości od 0 do 100 są ukryte.
Czy jeszcze w tym wykresie czegoś brakuje?
Dodawanie strzałek
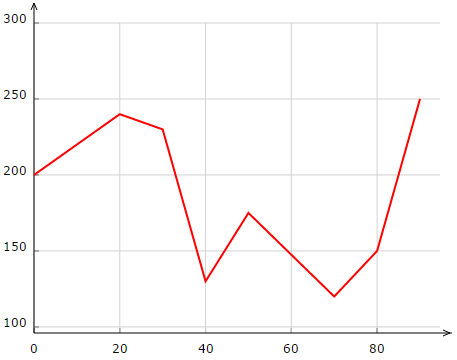
Każdy szanujący się wykres powinien mieć strzałki. Strzałki mają pokazywać kierunek przepływu wartości na osi.
g.append("svg:path")
   .attr("class", "axisArrow")
   .attr("d", function () {
       var x1 = x(xUpLim) + 23, x2 = x(xUpLim) + 30;
       var y2 = -y(yLowLim), y1 = y2 - 3, y3 = y2 + 3
       return 'M' + x1 + ',' + y1 + ',' + x2 + ',' + y2 + ',' + x1 + ',' + y3;
   });

g.append("svg:path")
.attr("class", "axisArrow")
.attr("d", function () {
    var y1 = -y(yUpLim) - 13, y2 = -y(yUpLim) - 20;
    var x2 = x(xLowLim), x1 = x2 - 3, x3 = x2 + 3
    return 'M' + x1 + ',' + y1 + ',' + x2 + ',' + y2 + ',' + x3 + ',' + y1;
});
Trzeba jeszcze te strzałki odpowiednio ostylować w CSS.
.axisArrow {
stroke: black;
stroke-width: 1;
}
Wykres teraz wygląda znacznie lepiej.
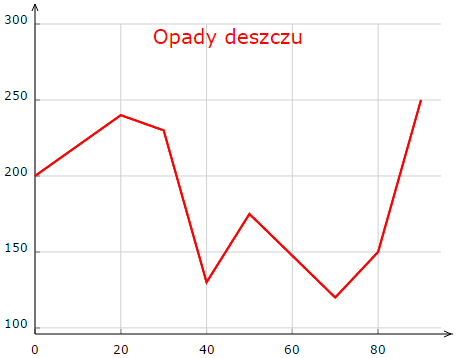
Każdy wykres ma jeszcze swój tytuł. W końcu jak mam wiedzieć, o czym jest ten wykres
g.append("svg:text")
    .attr("x", (w / 2))
    .attr("y", -h + margin_y + 20)
    .attr("text-anchor", "middle")
    .style("font-size", "20px")
    .style("fill", "red")
    .text("Opady deszczu");
Pojawia się tutaj jednak mały problem, wynikający z tego, że marginesy X i Y są za małe. Nie ma jak umieścić tytułu wykresu.
Problem się też pojawił, gdy chciałem dodać podpis wartości na osi Y i X. Podpisy te są bez sensu, ale trzeba pamiętać, że jest to przykład ![]()
Musiałem nie tylko zmienić marginesy, ale też definicję strzałek i wartości tekstowych.
g.append("svg:text")
   .attr("x", (w / 2))
   .attr("y", -h + margin_y - 15 )
   .attr("text-anchor", "middle")
   .style("font-size", "20px")
   .style("fill", "red")
   .text("Opady deszczu");

g.append("svg:text")
   .attr("x", 45)
   .attr("y", -h + margin_y - 30)
   .attr("text-anchor", "end")
   .style("font-size", "11px")
   .text("[mm]2");

g.append("svg:text")
    .attr("x", w - 10)
    .attr("y", -25)
    .attr("text-anchor", "end")
    .style("font-size", "11px")
    .text("czas [h]");
Oto cały kod JavaScript, który ma poprawione marginesy na wykresie.
w = 450;
h = 350;
margin_x = 52;
margin_y = 40;

var objects = [{ x: 0, y: 200 }, { x: 10, y: 220 }, { x: 20, y: 240 },
        { x: 30, y: 230 }, { x: 40, y: 130 }, { x: 50, y: 175 },
        { x: 70, y: 120 }, { x: 80, y: 150 }, { x: 90, y: 250 }];

var ax = [];
var ay = [];

objects.forEach(function (d, i) {
    ax[i] = d.x;
    ay[i] = d.y;
})

var xMax = d3.max(ax);
var yMax = d3.max(ay);

var xLowLim = 0;
var xUpLim = d3.max(ax);
var yUpLim = 1.2 * d3.max(ay);
var yLowLim = 0.8 * d3.min(ay);

y = d3.scale.linear().domain([yLowLim, yUpLim]).range([0 + margin_y, h - margin_y]);
x = d3.scale.linear().domain([xLowLim, xUpLim]).range([0 + margin_x, w - margin_x]);

var line = d3.svg.line()
    .x(function (d) { return x(d.x); })
    .y(function (d) { return -y(d.y); })

var svg = d3.select("body")
    .append("svg:svg")
    .attr("width", w)
    .attr("height", h)

var g = svg.append("svg:g")
    .attr("transform", "translate(0," + h + ")");

//draw the x ticks
g.selectAll(".xTicks")
    .data(x.ticks(5))
    .enter().append("svg:line")
    .attr("class", "xTicks")
    .attr("x1", function (d) { return x(d); }).attr("y1", -y(yLowLim))
    .attr("x2", function (d) { return x(d); })
    .attr("y2", -y(yLowLim) - 5);

// draw the y ticks
g.selectAll(".yTicks")
 .data(y.ticks(5))
 .enter().append("svg:line")
 .attr("class", "yTicks")
 .attr("y1", function (d) { return -y(d); })
 .attr("x1", x(xLowLim))
 .attr("y2", function (d) { return -y(d); })
 .attr("x2", x(xLowLim) + 5)
//draw the x grid
g.selectAll(".xGrids")
 .data(x.ticks(5))
 .enter().append("svg:line")
 .attr("class", "xGrids")
 .attr("x1", function (d) { return x(d); })
 .attr("y1", -y(yLowLim))
 .attr("x2", function (d) { return x(d); })
 .attr("y2", -y(yUpLim))

// draw the y grid
g.selectAll(".yGrids")
 .data(y.ticks(5))
 .enter().append("svg:line")
 .attr("class", "yGrids")
 .attr("y1", function (d) { return -y(d); })
 .attr("x1", x(xUpLim) + 20)
 .attr("y2", function (d) { return -y(d); })
 .attr("x2", x(xLowLim))

// draw the x axis
g.append("svg:line")
 .attr("x1", x(xLowLim))
 .attr("y1", -y(yLowLim))
 .attr("x2", 1.2 * x(xUpLim))
 .attr("y2", -y(yLowLim))

// draw the y axis
g.append("svg:line")
 .attr("x1", x(xLowLim))
 .attr("y1", -y(yLowLim) )
 .attr("x2", x(xLowLim))
 .attr("y2", -1.2 * y(yUpLim))

//draw the xLabels
g.selectAll(".xLabel")
    .data(x.ticks(5))
    .enter().append("svg:text")
    .attr("class", "xLabel")
    .text(String)
    .attr("x", function (d) { return x(d)})
    .attr("y", -20)
    .attr("text-anchor", "middle");

// draw the yLabels
g.selectAll(".yLabel")
    .data(y.ticks(5))
    .enter().append("svg:text")
    .attr("class", "yLabel")
    .text(String)
    .attr("x", 45)
    .attr("y", function (d) { return -y(d)})
    .attr("text-anchor", "end");

g.append("svg:path")
    .attr("class", "axisArrow")
    .attr("d", function () {
        var x1 = x(xUpLim) + 43, x2 = x(xUpLim) + 30 + 20;
        var y2 = -y(yLowLim), y1 = y2 - 3, y3 = y2 + 3
        return 'M' + x1 + ',' + y1 + ',' + x2 + ',' + y2 + ',' + x1 + ',' + y3;
    });

g.append("svg:path")
 .attr("class", "axisArrow")
 .attr("d", function () {
     var y1 = -y(yUpLim) - 30, y2 = -y(yUpLim) - 40;
     var x2 = x(xLowLim), x1 = x2 - 3, x3 = x2 + 3
     return 'M' + x1 + ',' + y1 + ',' + x2 + ',' + y2 + ',' + x3 + ',' + y1;
 });

g.append("svg:text")
    .attr("x", (w / 2))
    .attr("y", -h + margin_y - 15 )
    .attr("text-anchor", "middle")
    .style("font-size", "20px")
    .style("fill", "red")
    .text("Opady deszczu");

g.append("svg:text")
    .attr("x", 45)
    .attr("y", -h + margin_y - 30)
    .attr("text-anchor", "end")
    .style("font-size", "11px")
    .text("[mm]2");

g.append("svg:text")
 .attr("x", w - 10)
 .attr("y", -25)
 .attr("text-anchor", "end")
 .style("font-size", "11px")
 .text("czas [h]");

g.append("svg:path").attr("d", line(objects));
Oznaczenie punktów na wykresie
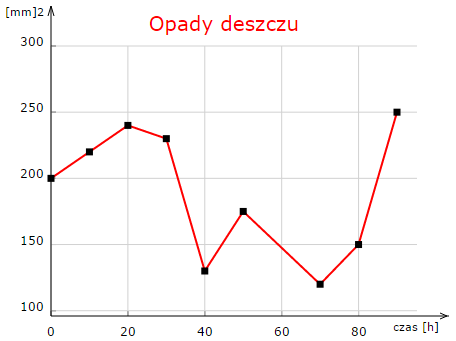
Czego jeszcze brakuje na tym wykresie? Może trzeba oznaczyć poszczególne punkty na wykresie.
svg.selectAll(".dot")
    .data(objects)
    .enter().append("rect")
    .attr("class", "dot").attr("width", 7)
    .attr("height", 7)
    .attr("x", function (d) { return x(d.x) - 3.5; })
    .attr("y", function (d) { return h - (y(d.y) + 3.5); });
Oto kolejny kod JavaScript, który doda kropki tam, gdzie są wartości. Kropki mają długość i wysokość 7 pikseli, więc ma on średnicę 3.5. Ułamki nie istnieją, więc wartości zostaną zaokrąglone. Kropki na osi X łatwo umieścić wystarczy skorzystać z funkcji skalującej X minus średnica punktu.
Z osią Y jest trochę trudniej, bo jest to całkowita wysokość minus wynik skalującej funkcji Y plus średnica punktu.
Wynika to z tego, że definicja skalowania Y jest bazowo odwrócona.
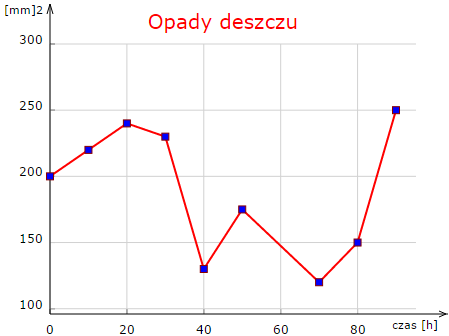
Pozostało jeszcze do naszych kropek dodać odpowiedni kolor i obramowanie.
.dot {
 stroke: darkred;
 fill: blue;
}
Niebieski niezbyt dobrze komponuje się z czerwonym.
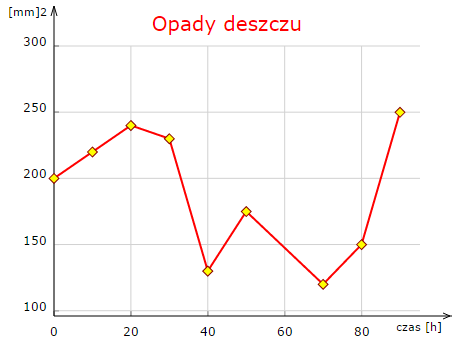
Kolor żółty będzie lepszy.
.dot {
 stroke: darkred;
 fill: yellow;
}
Punkty warto też obrócić.
svg.selectAll(".dot")
    .data(objects)
    .enter().append("rect")
    .attr("class", "dot").attr("width", 7)
    .attr("height", 7)
    .attr("x", function (d) { return x(d.x) - 3.5; })
    .attr("y", function (d) { return h - (y(d.y) + 3.5); })
    .attr("transform", function (d) {
        var str = "rotate(45," + x(d.x) + "," + (h - (y(d.y) + 3.5 )) + ")";
        return str;
});
W funkcji obracającej w SVG trzeba podać dokładnie środek punktu. Trzeba więc skopiować działanie matematyczne, które ustawiło punkt.
Jeśli chodzi o wykresy liniowe. Pozostało jeszcze stworzyć bardziej konkretny przykład, na którym mamy więcej linii.
